Here are some more visuals based on my analysis of average shot locations from the NBA Regular Season 2012-13...
See previously:
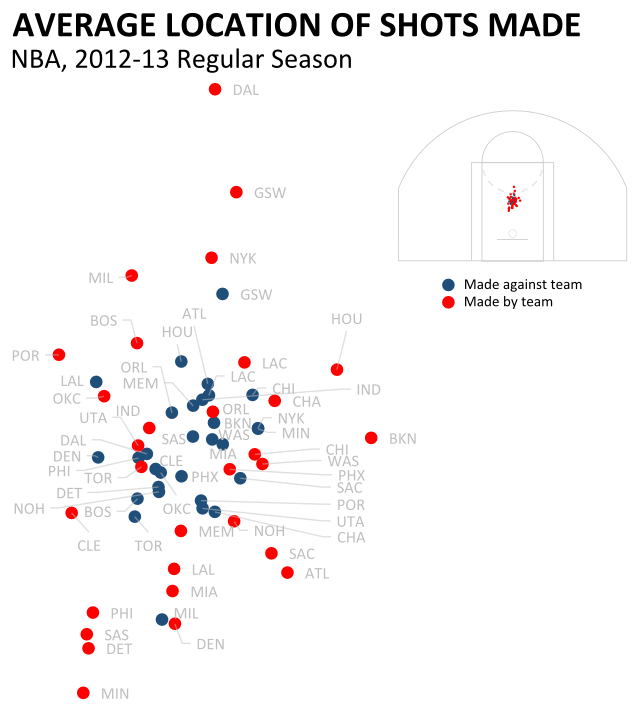
Average Location of Shots Made - NBA 2012-13 Regular Season by teams and against teams...
-
Shots made by a team show more variation than shots made against a team. Where you shoot from depends more on who you are than who you are playing against -- fine.
-
A lot more front-back variation than side-to-side, probably to be expected
-
Shots made by MIN, DET, SAS close to the net and DAL, GSW, NYK far away somewhat interesting. Fairly big difference here actually which can probably be chalked up to specific players
-
Shots made against probably more interesting. MIL way down at the bottom, GSW significantly at the top. What about these teams' defensive style means they are more inclined to allow shots close or far from the net?
Sketch (not poblished):
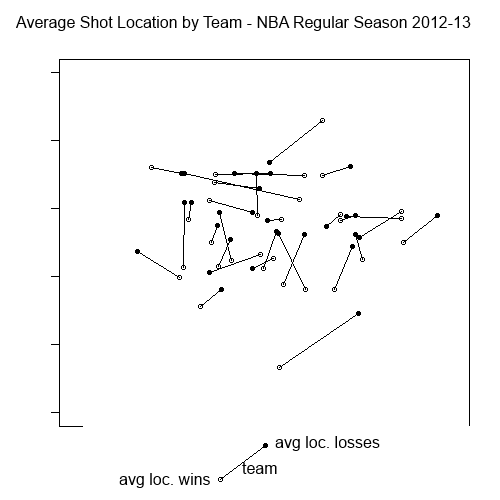
Average Shot Location by Team by Win/Loss - NBA Regular Season 2012-13
Every line represents a team and connects the two points for that team. The white dot for a team is the average location of shots attempted in games that team won. The black dot for a team is the average location of shots attempted in games that team lost.
Analysis:
-
Most wins and losses points are near one another
-
Lines generally do not cross
-
There are a number of teams across the middle of the chart who attempt shots closer to the net more often when they win
-
Variation is left/right variation is probably just statistical noise
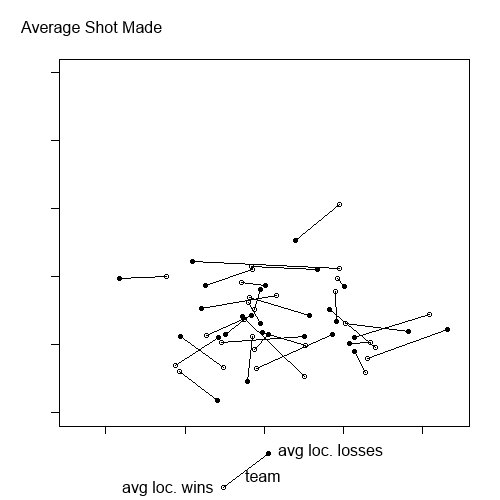
Same chart but filtering for only successful shots... same story, though less evidence that closer shots are important for winning:
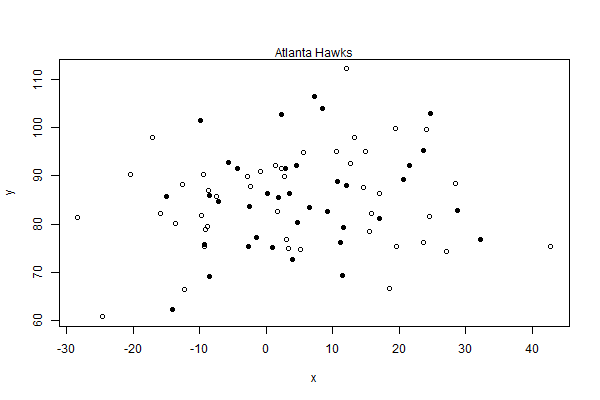
We could also look at the games for an individual team... and I think learn nothing: