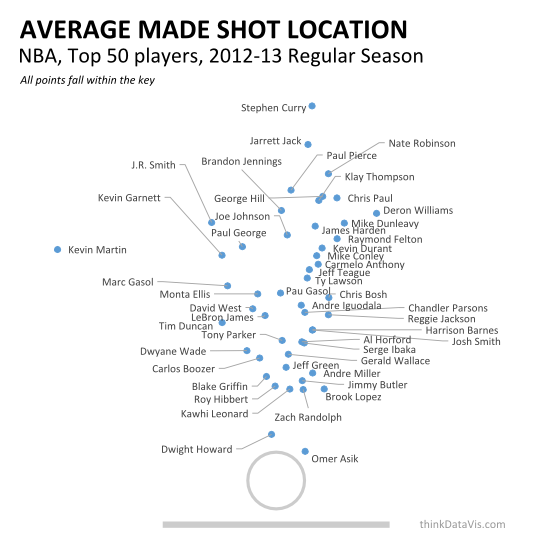
In the 2012-13 regular season, tens of thousands of shots were taken. How can we visualize these in a useful manner? What is the average location of successful shot attempts? How do the top 50 players compare?
Note: In terms of magnitude, the points above fall roughly within the key.
Interesting observations:
-
Outliers or rather, those players who are the most different:
-
Omer Asik and Dwight Howard very close to the basket
-
Stephen Curry and Jarrett Jack very far from the basket
-
Kevin Martin way out to the left
-
-
Right-hand bias. The majority of players are making shots on average from the right-hand side of the court
-
Trend. Notice that the dots seem to form a line. The majority of the players are on the right-hand side and as you move further from the basket, they also move further right. This may reveal something fundamental about the game, that there is some sort of ideal-angle to be shooting from. Note that the points on the left-hand side may have a similar trend, but it's not as strong.
Know something about basketball? What insights do you get from this chart?
More about this from a data visualization perspective in another post.
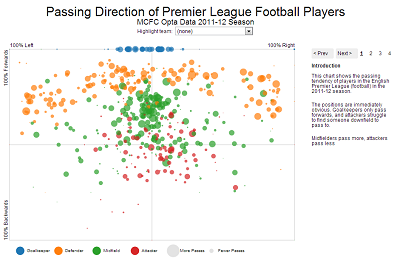
See also my work on the average passing direction in the English Premier League (Football (Soccer)):