Yet another post on visualising and analysing NBA shot location data using location averaging methods.
Previously I have shown averages by team for all shots taken. What about shots taken by zone? Consider the following two charts:
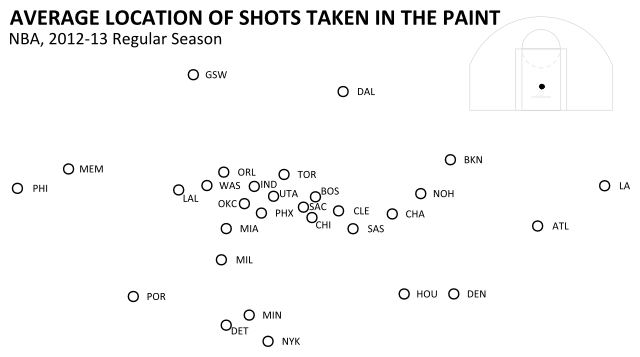
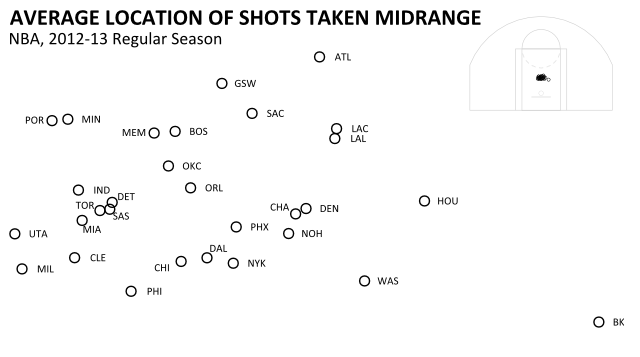
Now we can see a level of detail that we couldn't in the average of all shots.
Previously:
Observations:
-
Previously we saw that the GSW were the longest shooters in the league and indeed they were also long shooters in the paint and at midrange. It is not simply that the GSW take a lot of 3s.
-
Other teams like the NYK take shots from close up in both the paint and at midrange. They were generally longer shooters in the previous analysis, suggesting that they balance those close 2-pts with many 3-pt attempts
-
Previously we saw DEN as the closest shooters overall, and indeed they appear to be close shooters in the paint and moderately close shooters at midrange.