Since 1996, the ten best paid Ontario university presidents have seen their packages increased on average about 5.1% annually. This compares to:
-
4.0% for the 10,000th best paid person on the Sunshine List since 2001 (when there first were 10,000 names on the list)
-
3.5% annually for the 20,000th best paid since 2004
-
5.5% annually for Pathologists since 1996
While not as shocking as the single-year 22% raise that I previously identified for pathologists, this is evidence that university presidents are in the elite club for whom the sun shines strongly. As I have shown previously, those at the top in Ontario not only higher salaries, and bigger raises in absolute dollars, but also larger percentage increases annually which compound and lead to bigger gap between them and everyone else.
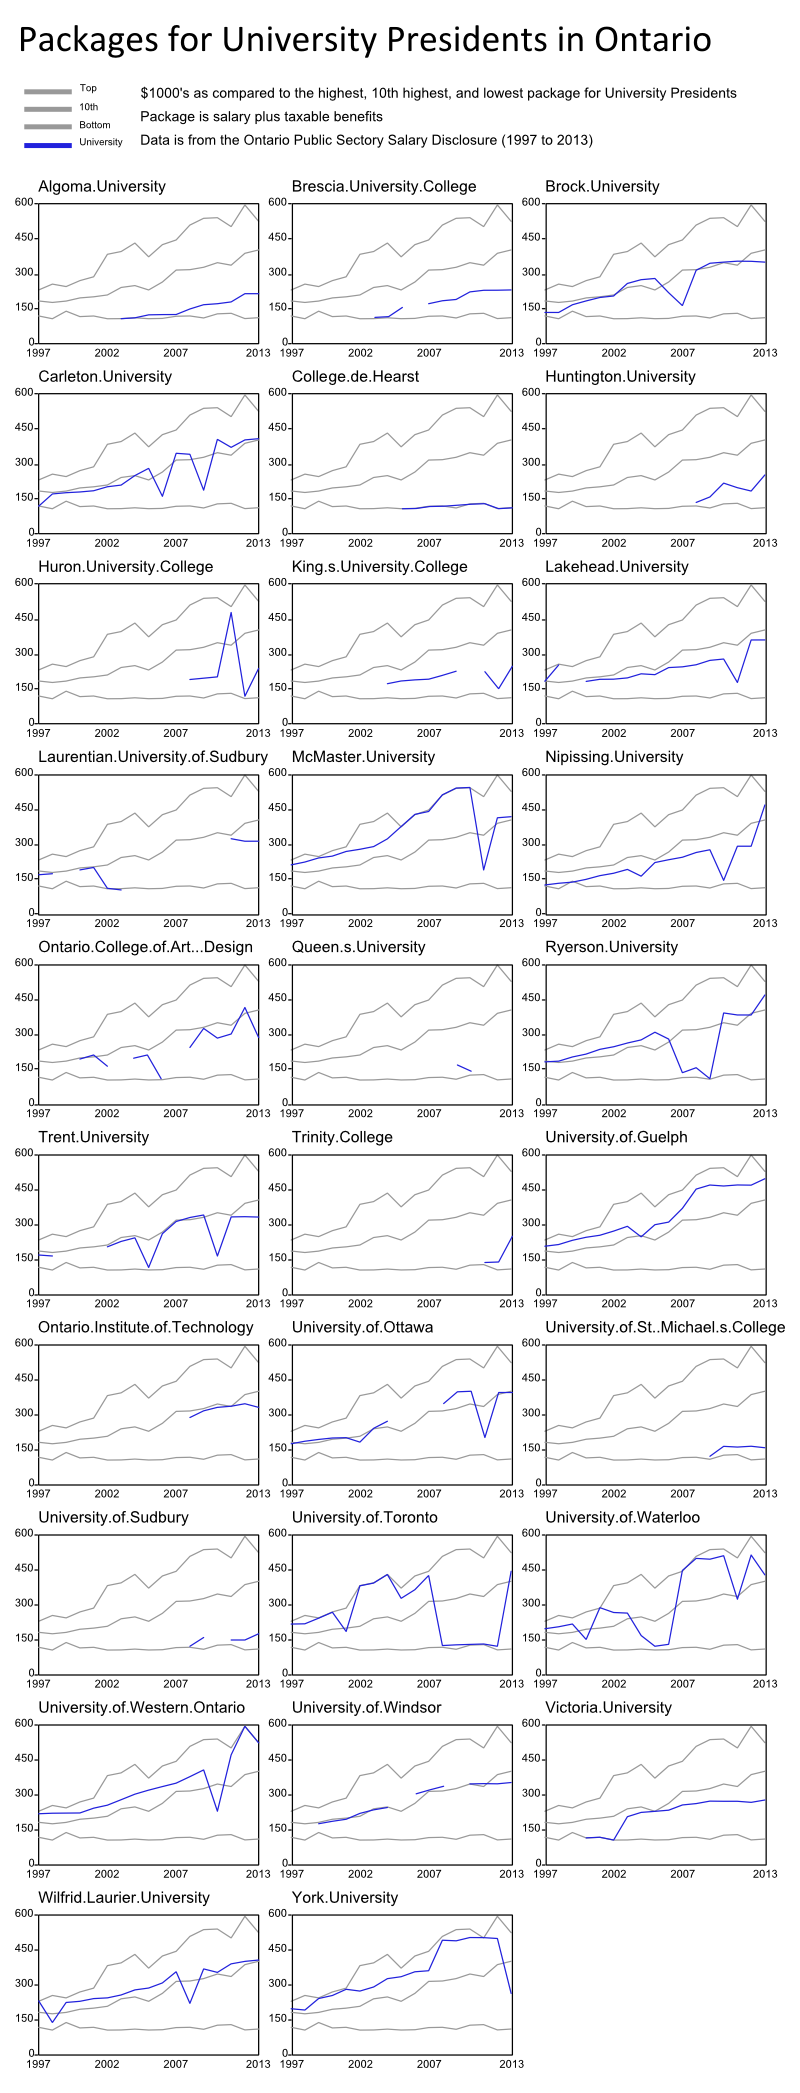
Explore the data below:
Questions and Answers
Why are there sudden dips in the lines?
For example, Brock in 2007 and Carleton in 2006 and 2009. When an outgoing or incoming president works only a portion of a year, they earn less and are reported as less.
Why is there missing years sometimes?
As with sudden dips in the lines, if both the outgoing and incoming presidents work only a portion of the year and only earn less than $100,000, they will not qualify for disclosure and there will be no data for them. Also in some years the data may be outright missing.
Why is there almost no data for Queen’s?
I struggled to identify presidents of Queen’s in the data. Perhaps their structure is different. I took Daniel R. Woolf, Principal - Principal's Office for 2013, and Wade G. Hall, Executive Director Development for 2010 and 2009, but this is probably wrong. Any experts on the structure can feel free to inform me and I can make the appropriate correction.
Why do many lines start after 1997?
Before this period, the given presidents did not earn more than $100,000 and did not qualify for disclosure.