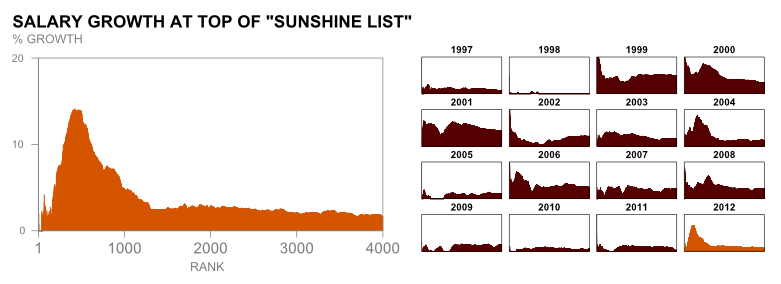
I have previously shown that 2012 was a good year for the highest paid individuals in the Ontario Public Sector Salary Disclosure ("Sunshine List"). The top 1,000 best paid workers saw salary growth of average 7.2% where everyone else saw 2.2%. It can further be shown that 2012 was one of the biggest years for disproportionate growth at the top. Only 2008 shows a bigger gap between the 1,000 best paid and everyone else:

Furthermore, We can see that:
-
A similar shape to 2012 in 2008, 2006, 2004, and 2000. In all of these years, the very top (1000 or so) of the list saw considerably more growth than those near the top (ranks 1000 to 4000 or so).
-
2009-2011 were weak growth years, with 2009 and 2011 showing actually lower salary growth at the very top
More
You can read more on this topic in a piece in the Financial Post which cites these findings.