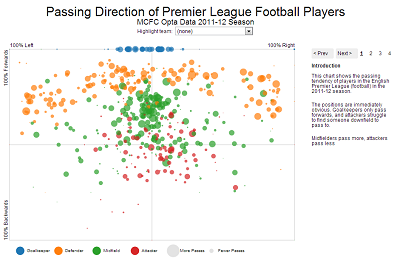
The guys over at MCFC Analytics have released a dataset for the entire 2010-11 English Premier League Football season. This has generated a number of visuals on passing. For the time being, only aggregate by-game data is available for the entire season, but in-game event data for all games should follow. This is my first project, likely in a series on MCFC data.
Passing Direction of Premier League Football Players
This visualisation is an excellent tool for outlier identification. With players scattered and coloured by position, we can immediately see who the oddballs are. Who are the defenders that pass more like a midfielder? Vise versa? If I were more intimately familiar with the game, this would lead me down a path of investigation to determine what is different about that player. Is it interesting? Is it positive?
Similar analyses carry value in the business world also. A retailer may have many locations and formats, but within those formats are there stores that behave outside of the norm? Do we have large format stores that look more like small format stores in the data? Is there a cost savings opportunity?
In terms of technology, this is another application of D3.js and SVG. Unfortunately that means it won't work on browsers IE8 and below. If this piece were to be part of a wide-ranging, consumer-facing project, then a graceful degradation for IE8 would be required. If this were an internal business tool, a particular browser could be mandated (though this unfortunately might be IE8 or below). Since this is a personal project, I choose not to spend the hours to support IE8.
