When it comes to data visualisation design, it's always important to consider your purpose and your audience. Are you trying to convince your audience of a particular point of view? Are you giving your audience an platform from which to explore and find their own insights? In my latest piece I take a step down a less discussed path.
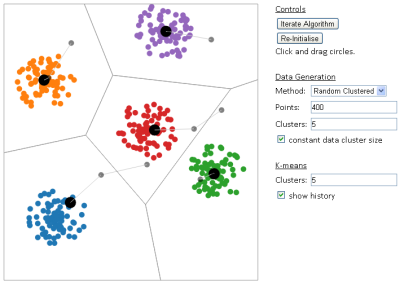
I have created an interactive tool using D3.js that gives the user a chance to see and interact with the typical k-means clustering algorithm from data mining/machine learning. It is my hope, that it will enable students to develop an intuition for how the algorithm works, and a better appreciation of its shortcomings.
You can learn more about k-means clustering here.